Correlated pairs risk: are you carrying the same trade twice?
Updated 2026-06-09
Two same-direction positions in strongly correlated pairs behave like one larger position. Long EURUSD plus long GBPUSD is twice short the US dollar, so one adverse dollar move can hit both stops together. Correlation is computed over a stated lookback window, drifts constantly, and stock MetaTrader 4 includes no tool that displays it.
Is long EURUSD and long GBPUSD really two trades?
Put the arithmetic on the table first. Say an account holds two positions, long EURUSD and long GBPUSD, each with a stop placed so the position loses one unit of risk if it is hit. On paper that looks like two separate one-unit bets. It rarely behaves that way.
Both pairs are a European currency priced against the US dollar, and over most lookback windows their rolling correlation reads strongly positive. When the dollar strengthens across the board, both pairs fall together. The event that hits the first stop is, more often than not, the same event that hits the second. So the honest description of that account is not two trades risking one unit each. It is one dollar-direction trade risking up to two units, dressed up as diversification.
The same stacking happens with opposite tickets in inversely related pairs. Long EURUSD and short USDCHF are both short the US dollar, so a broad dollar rally can hit both even though the tickets point different ways. The direction on the ticket and the direction of the exposure are not the same thing.
None of this says the correlation sits fixed at some tidy number. It drifts with every window, which is exactly why it needs checking rather than assuming. The point of the arithmetic is narrower: when two positions share a driver, the worst case is close to the sum of both risks, and a stop on each ticket does not change that, because one move can take both stops out in the same session.
What correlation is too high between forex pairs?
The usual answer is a rule-of-thumb convention, not a statistical law. The bands most traders quote look like this:
| Coefficient (absolute) | Conventional label | For two same-direction positions |
|---|---|---|
| 0.0 to 0.3 | Weak | Moves mostly unrelated over that window |
| 0.3 to 0.7 | Moderate | Partial overlap, some shared risk |
| 0.7 to 0.9 | Strong | Commonly treated as one shared risk event |
| 0.9 to 1.0 | Very strong | Behaves close to a single doubled position |
Treat the table as exactly what it is, convention. Nothing magical happens between 0.69 and 0.71, no statistics text blesses 0.7 as a cliff edge, and the bands exist only because traders need some line to act on. The convention most commonly quoted is that an absolute reading above about 0.7, measured over the window you actually trade, is high enough to count two same-direction positions as one risk event rather than two.
Two caveats stop the table being misused. First, the coefficient is window-dependent, the same two pairs can sit in different bands on different lookbacks, so a band label without its window is meaningless. Second, the sign interacts with direction: a strongly negative reading stacks risk just as hard when the tickets point in opposite directions. The better question than "what number is too high" is "what happens to this account if these positions lose together". The table is a shortcut to that question, not a substitute for it.
How do you read a currency correlation table?
A correlation table, often called a matrix, lists the same symbols across the rows and the columns. Each cell holds the coefficient between its row symbol and its column symbol, measured over one specific lookback window on one specific timeframe. Values run from -1 to +1, often displayed as -100% to +100%. The diagonal is always +1, every pair tracks itself perfectly, and the matrix mirrors across it, so EURUSD against GBPUSD equals GBPUSD against EURUSD.
Reading one is three checks:
- Find the window and timeframe first. A footnote like "50 daily bars" or "200 H1 bars" is the most important text on the page. The same two pairs can print 0.9 on one window and 0.4 on another, so a coefficient without its window is a number without a meaning.
- Read sign, then size. Positive means the two symbols tended to move together over that window, negative means they tended to move opposite, and the magnitude says how tightly.
- Map it to your tickets. Same direction in positively correlated pairs stacks exposure. Opposite directions in positively correlated pairs offset. With negative correlation it flips, same direction offsets, opposite directions stack.
One deliberate omission: this guide does not print a matrix of real readings. Any such table is a dated snapshot, true for its window on its day and stale soon after. If you use a published one, check when it was computed and over how many bars before leaning on it. Better still, compute the reading live on your own platform for the window you trade.
Why do EURUSD and GBPUSD move together in the first place?
The big co-movements have structural causes, which is why they keep showing up window after window.
- A shared dollar leg. EURUSD, GBPUSD, AUDUSD and NZDUSD all price something against the US dollar. When the dollar moves broadly it moves the lot, and that one shared leg accounts for much of the co-movement among the majors.
- Linked economies. The euro area and the United Kingdom trade heavily with each other, so EUR and GBP often absorb the same shocks. That is the structural reason long EURUSD plus long GBPUSD keeps reading as one trade.
- Commodity blocs. AUD and NZD lean on overlapping exports and the same regional flows, which is why AUDUSD and NZDUSD have so often tracked each other.
- Cross construction. Some relationships are near-mechanical. EURGBP is effectively EURUSD divided by GBPUSD, so its moves are arithmetic relatives of the other two.
The honest caveat: these are tendencies, not constants. GBP can decouple from EUR violently on a UK-specific shock, the dollar leg can go quiet while a domestic story dominates one currency, and the commodity twins drift apart when their central banks diverge. Structure explains the average relationship, it does not promise today's. Which is why the structural list is a reason to check the current reading, never a substitute for checking it.
Why does the correlation number keep changing?
Because it is computed over a rolling window. Every new bar that closes pushes the oldest bar out of the calculation, so the reading is permanently in motion. On a short window a single outsized bar entering or leaving can swing the value hard, a 20-bar reading is reactive and noisy, a 200-bar reading is smoother but slow to admit the relationship has changed. Different timeframes disagree too, the H1 reading and the daily reading for the same two pairs are answers to different questions, and neither is the "real" one.
The deeper limitation is that correlation is descriptive, not predictive. It reports the relationship that existed over the bars just measured and says nothing binding about the next bar. Relationships shift with market regimes, and they have a habit of bending or breaking during stress, which is precisely when stacked positions do the most damage. A reading that held for months is evidence about the past, not a contract about the future.
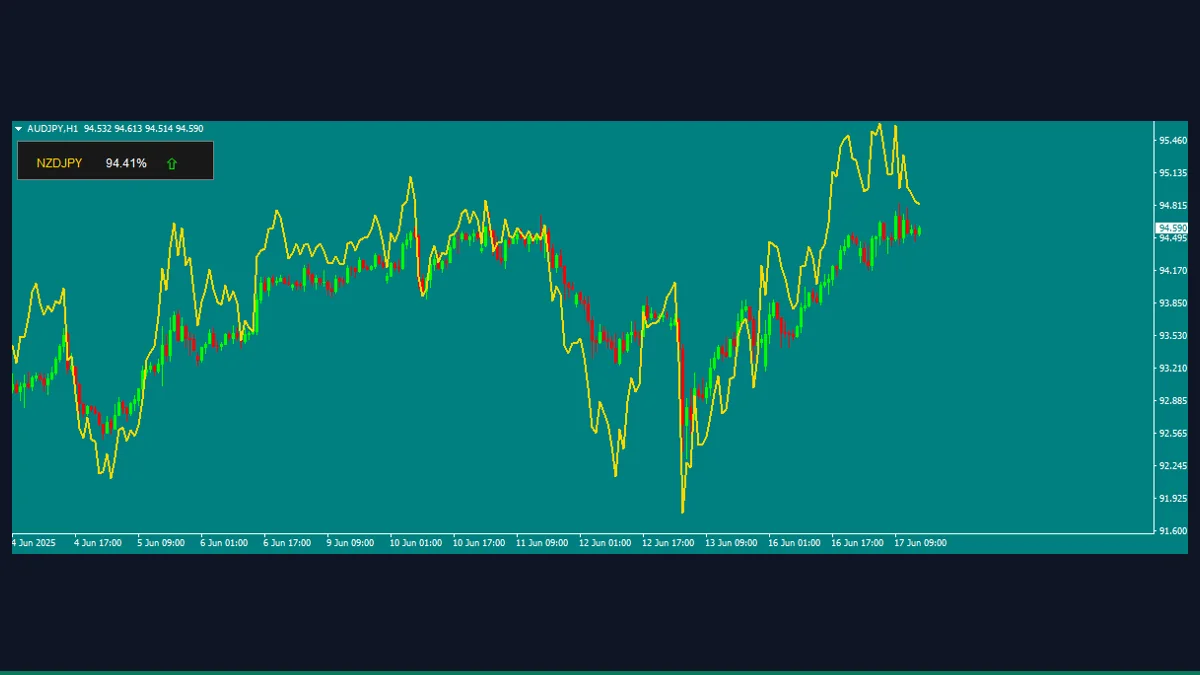
The free on-chart tool in this library behaves the same way, by design. Its CorrelationPeriod input defaults to a 20-bar window and the value recomputes as the current bar forms, so the latest number moves until the bar closes. That is normal for any rolling measure, not a defect, but it is worth knowing before you treat the last printed value as settled.
How do you check correlation inside MetaTrader 4?
Stock MetaTrader 4 has no correlation display. The standard indicator set, the trend tools, oscillators, volumes and the Bill Williams group, contains nothing that compares two symbols, and the Market Watch window does not either. To see a reading inside the platform you load a custom tool.
The free, MIT-licensed Correlation Indicator in this library does the job for its supported symbols. It computes a rolling Pearson correlation over a configurable window, 20 bars by default, prints the value as a percentage on a small top-left panel with a direction arrow for the partner symbol, and overlays a normalised projection of the partner over your candles. Its honest limitations: the partner is auto-assigned from a fixed table, attach it to EURUSD and it measures against GBPUSD, USDJPY pairs with USDCHF, gold with silver, so you cannot pick an arbitrary second symbol, and an unsupported chart symbol triggers an alert and the indicator refuses to load. The plotted line is the normalised overlay, not the coefficient itself, the number lives on the panel.
Installation is the usual copy into MQL4/Indicators, the install guide walks it through in under a minute, and the not-showing checklist covers the cases where it refuses to appear.
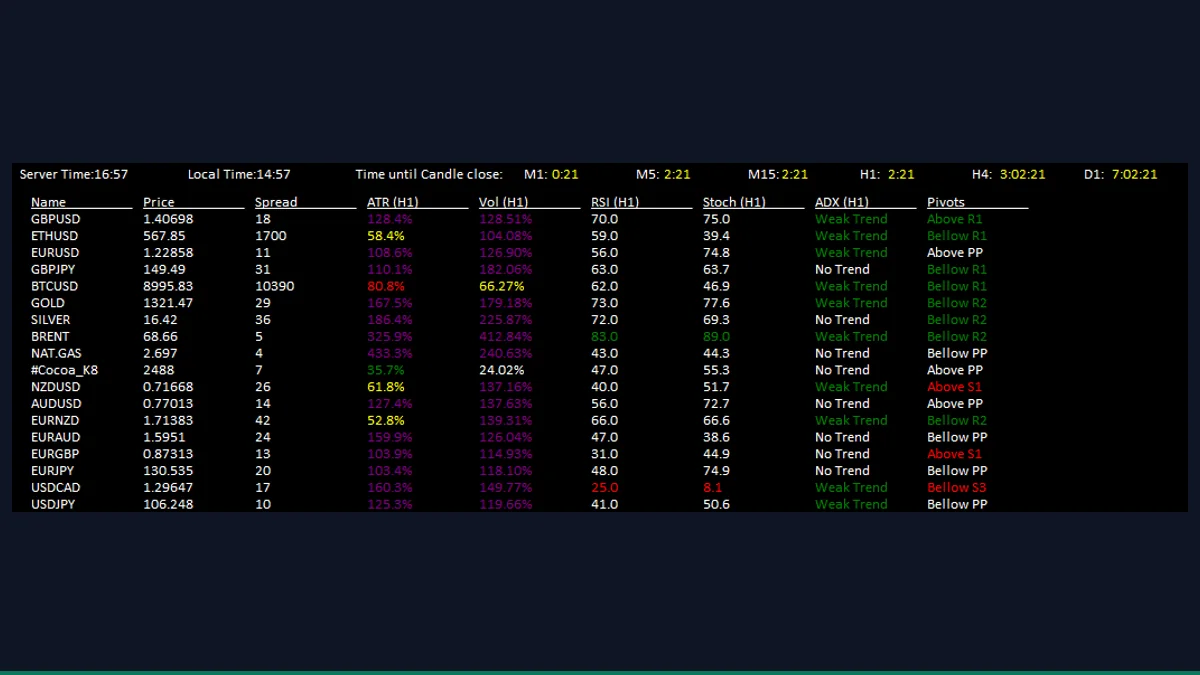
For the wider book view, the Forex Scanner Dashboard puts a whole watchlist in one on-chart table, price, spread, swap, ATR, RSI, ADX and more per symbol. It does not compute correlation, but it makes overlapping exposure easier to spot, and when half the rows are dollar pairs pointing the same way, that is the stacking problem from the top of this page staring back at you.
Correlation risk questions
Is it bad to trade EURUSD and GBPUSD at the same time?
There is nothing mechanically wrong with it, MetaTrader 4 will happily hold both. The arithmetic point is that two same-direction positions in strongly correlated pairs behave closer to one larger position than to two independent ones, so the worst-case loss on a shared dollar move is roughly the sum of both risks. Whether that combined exposure is acceptable is a judgement only the account holder can make.
Does MetaTrader 4 have a built-in correlation matrix?
No. The standard indicator set that ships with MT4, the trend tools, oscillators, volumes and Bill Williams groups, contains nothing that measures the relationship between two symbols. To see a reading inside the platform you install a custom indicator, such as the free Correlation Indicator in this library, or compute the number outside MT4 from a source that states its date and lookback window.
Is 0.7 a high correlation between currency pairs?
By the common rule of thumb, yes. An absolute reading around 0.7 is where many traders start counting two positions as one shared risk event. But the cut-off is convention, not statistics, nothing changes between 0.69 and 0.71, and the same two pairs can read 0.9 on one lookback window and 0.4 on another. The window the number was computed over matters as much as the number.
Do negatively correlated pairs cancel each other out?
Only partly, and only while the relationship holds. Opposed exposures in negatively correlated pairs can offset on paper, but the coefficient is measured from a past window and can weaken or flip, often during exactly the volatile periods when the offset would matter most. Each position also keeps its own spread, swap and gap risk, so the offset is never complete and never guaranteed.
Free tools to start with
Correlation Indicator
Measures rolling correlation between the chart symbol and a second instrument you choose.
Forex Scanner Dashboard
A multi-pair dashboard that scans your watchlist and flags momentum and level conditions at a glance.
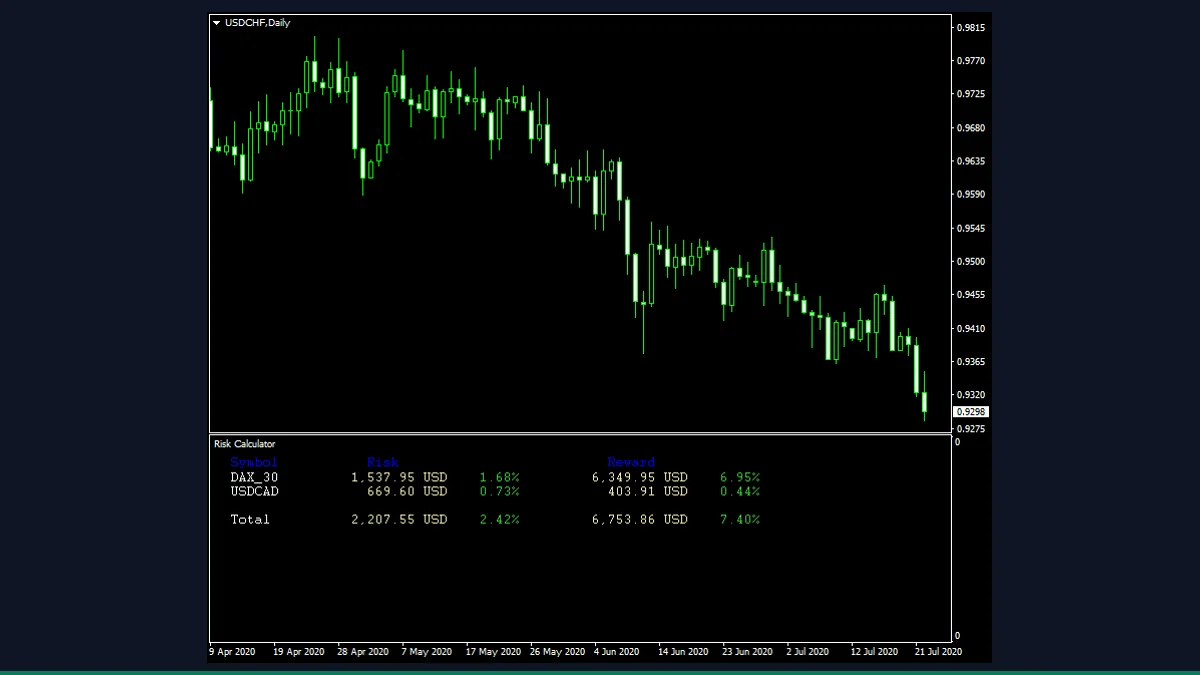
Risk Calculator
Reads your open and pending orders to show total risk and reward in both money and percent.