Correlation Indicator for MetaTrader 4
- Category
- Levels & Market Structure
- Platform
- MetaTrader 4
- Repaints?
- See the honest review below
- Licence
- MIT
- Inputs
- 2
- Price
- Free
The Correlation Indicator is a free, MIT-licensed MT4 tool by Mohamed Khaled. It overlays a normalized projection of a paired instrument on your chart and shows the rolling Pearson correlation, as a percentage, plus a trend arrow, on a small panel. It is for traders who watch correlated pairs and want a quick, on-chart read.
If you trade pairs that tend to move together, like EURUSD and GBPUSD or gold and silver, the Correlation Indicator gives you a quick on-chart read of how tightly your chart symbol and its partner are currently tracking. It draws the partner instrument over your candles and prints the rolling correlation as a percentage. Here is exactly what it does and where it falls short.
What is Correlation Indicator, and what does it do in MT4?
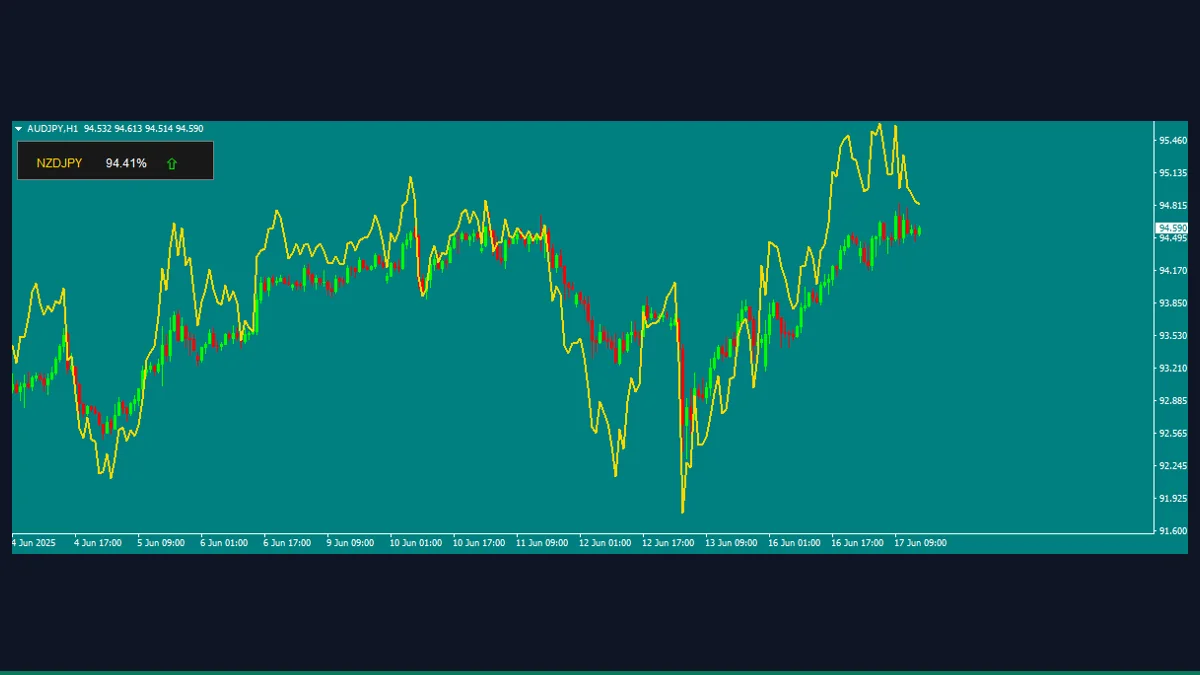
The Correlation Indicator is a free MetaTrader 4 study that measures the rolling statistical correlation between the symbol on your chart and a second, related instrument. It plots a single line in the chart window, a normalized projection of the paired instrument scaled onto your price axis, and adds a compact panel in the top-left corner showing the paired symbol name, the current correlation value as a percentage, and an up or down arrow for the partner's last-bar direction.
One important point the source code makes clear, the second instrument is not chosen from a dropdown. The pairing is decided automatically from your chart symbol using a fixed table. For example, attaching it to AUDUSD pairs it with NZDUSD, USDJPY pairs with USDCHF, gold pairs with silver, and Bitcoin pairs with the Nasdaq index. If your chart symbol is not in that supported list, the indicator shows an alert and does not load.
On each calculation pass the indicator pulls CorrelationPeriod bars of closes for both the chart symbol and its auto-assigned partner, converts each series to percentage change from a base price, and runs a standard Pearson correlation across the two change series. That single number, between roughly -1 and +1, is what drives the panel, displayed as a percentage by UpdatePanel.
For the visible line, the indicator does not plot the raw correlation. It overlays the partner instrument by taking your chart's close and adjusting it by the partner's recent percentage change, flipping the sign when the correlation is negative, so an inversely correlated partner is mirrored to read in the same direction as your chart. The arrow on the panel simply reflects whether the partner's last close was above the one before it.
Because the line and the correlation value are recomputed as new bars and ticks arrive, the most recent readings update in real time and the current bar can shift as it forms. This is normal for a rolling-window study, but it does mean the tool is descriptive, not predictive. It reports the relationship that exists right now, it does not forecast where either instrument is going.
Which Correlation Indicator inputs matter most?
The indicator exposes only three real inputs. Everything else, including the pair table and panel layout, is fixed in the code.
| Input | Default | What it controls |
|---|---|---|
| CorrelationPeriod | 20 | Number of bars in the rolling window used to compute the correlation and percentage changes. Lower is more reactive and noisier, higher is smoother and slower to respond. |
| IndicatorColor | Gold | Color of the overlaid partner line and the panel's symbol label. Cosmetic only. |
| ShiftValue | 0 | Horizontal bar shift applied to the plotted line via SetIndexShift. Leave at 0 unless you deliberately want the overlay offset. |
How do you add Correlation Indicator to MetaTrader 4?
- Unzip the download and locate the indicator file from the zip (the .mq4).
- In MetaTrader 4, click File, then Open Data Folder.
- Open the MQL4 folder, then the Indicators folder, and copy the .mq4 file into it.
- Back in MT4, right-click Navigator and choose Refresh, or restart the terminal, so the indicator appears.
- Open a chart for a supported symbol, for example EURUSD, USDJPY, or XAUUSD.
- Drag the Correlation Indicator from Navigator onto that chart and confirm any settings.
- Click OK, the overlay line and the correlation panel appear in the top-left of the chart.
Where does Correlation Indicator help, and where does it fall short?
What Correlation Indicator does well, and where it falls short, with nothing hidden.
- Free and MIT-licensed, so you can use, study, and modify the source without restriction.
- Gives a fast, glanceable read of the current correlation as a percentage right on the chart, no second window needed.
- Auto-detects broker symbol variations and suffixes, including common gold, silver, Bitcoin, and Nasdaq naming, so it usually finds the partner without manual setup.
- Works across forex majors, metals, and a few crypto and index pairings out of the box.
- Lightweight single-buffer study that adds negligible load to the platform.
- The partner instrument is fixed by a hardcoded table, you cannot pick an arbitrary second symbol despite what a 'choose your instrument' description might imply.
- Only works on the supported symbols, anything outside the list triggers an alert and the indicator refuses to load.
- The plotted line is a sign-flipped, normalized overlay, not the correlation coefficient itself, which can be confusing if you expect a value oscillating between -1 and +1 on screen.
- It updates as bars form, so the latest reading can change, it is a rolling descriptive measure, not a non-repainting fixed signal.
- It does not place trades, generate buy or sell signals, or predict direction, it only describes the existing relationship.
- The partner's data must exist at your broker, if the symbol is missing from Market Watch the correlation cannot be calculated.
Download Correlation Indicator free
Enter your email and we will send you Correlation Indicator for MetaTrader 4, packaged with its original MIT licence and a credit to Mohamed Khaled. Come back for any of the other free tools whenever you want one.
We never share or sell your email. One-click unsubscribe in every message.
Correlation Indicator: questions traders ask
Does this indicator repaint?
Yes, in the normal sense for a rolling-window study. The correlation value and the overlaid line are recalculated as new bars and ticks arrive, so the most recent reading can change. It is a descriptive measure of the current relationship, not a fixed, locked signal.
Can I choose any second instrument to correlate against?
No. Despite descriptions that suggest you pick one, the partner is assigned automatically from a fixed table based on your chart symbol. For example EURUSD pairs with GBPUSD and gold pairs with silver. You effectively choose the pair by which chart you attach it to.
Does it work on MetaTrader 5?
No. The source is written in MQL4 for MetaTrader 4. It would need porting to run on MT5.
Does it place trades or give buy and sell signals?
No. It is an analytical study only. It measures and displays correlation and a direction arrow, it does not open positions or produce trade signals, and it does not predict price.
Why does it show an alert and refuse to load?
The indicator only supports a specific list of symbols, such as the forex majors, gold, silver, and a few crypto and index pairs. If your chart symbol is not on that list, or the partner symbol does not exist at your broker, it alerts you and does not initialize.
Is it free?
Yes. It is released under the MIT license by Mohamed Khaled, so it is free to use and modify. A stray 'All Rights Reserved' note in the file header is superseded by the committed MIT grant in the repository.
Repo LICENSE is MIT by the same author; a stray 'All Rights Reserved' string in the header is superseded by the committed MIT grant.