Forex Scanner Dashboard for MetaTrader 4
- Category
- Levels & Market Structure
- Platform
- MetaTrader 4
- Repaints?
- See the honest review below
- Licence
- MIT
- Inputs
- 45
- Price
- Free
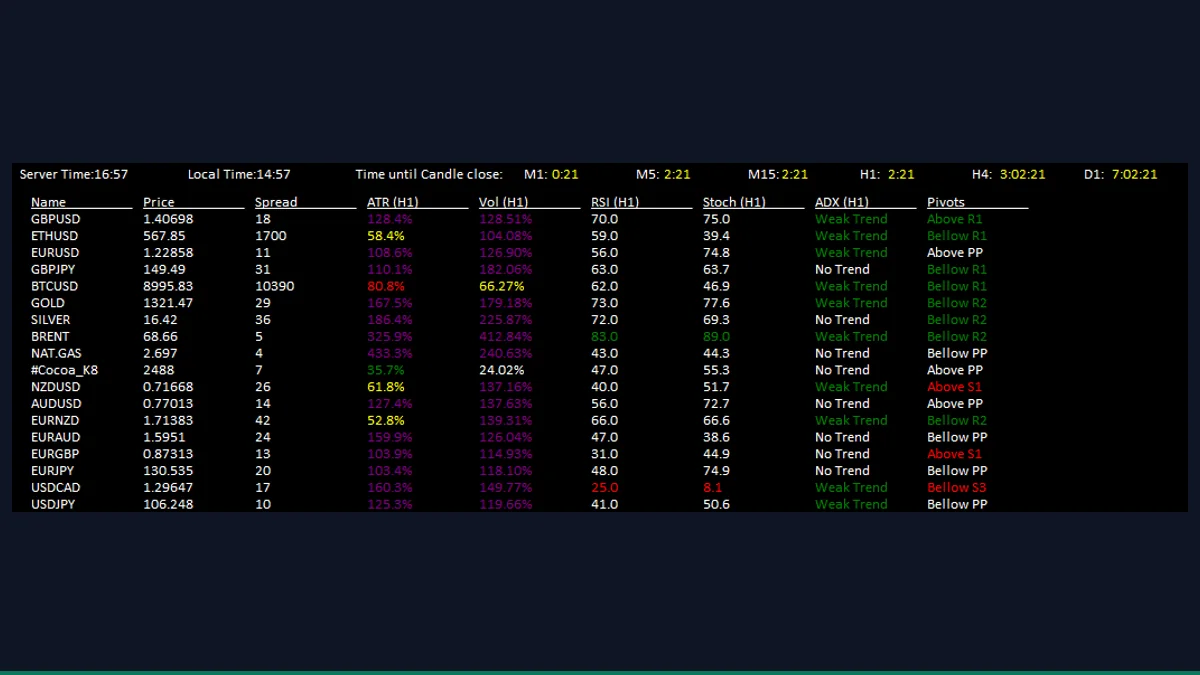
The Forex Scanner Dashboard is a free MT4 indicator that builds an on-chart table scanning your whole watchlist at once. For each symbol it reads price, spread, swap, ATR, RSI, Stochastic, ADX, pivots and moving-average conditions, refreshing on a timer. It is for traders who watch many pairs and want one screening panel instead of flipping charts.
If you trade more than a handful of pairs, opening a chart for each one to check conditions is slow. The Forex Scanner Dashboard reads your symbols in one pass and prints the results as a compact table on a single chart, so you can spot which markets are moving, overbought, trending or expensive to hold before you commit a chart to them.
What is Forex Scanner Dashboard, and what does it do in MT4?
The Forex Scanner Dashboard is a multi-symbol screening panel for MetaTrader 4. It is an indicator you drop on one chart, but it does not analyse only that chart's pair. Instead it loops over a list of symbols (either everything in your Market Watch or a custom list you type in) and, for each one, queries the standard MT4 indicators and quote data, then draws the values as rows and columns directly on the chart.
It is a dashboard utility, not a trade signal or a strategy. It tells you the current state of each market at a glance, things like ATR, RSI, Stochastic, ADX, pivot position and moving-average alignment, and leaves the decision and the execution entirely to you. Think of it as a watchlist screener that lives inside the terminal.
On load the indicator gathers a symbol list. With ShowSymbols set to MarketWatch it enumerates the symbols in your Market Watch window using SymbolsTotal; with Custom it parses the slash-separated names you put in CustomSymbols. It then starts an MT4 event timer so the whole table is recalculated and redrawn every TimerInterval seconds rather than on every incoming tick.
For each symbol the panel pulls live quote data through MarketInfo and SymbolInfo (bid price, spread, swap) and calls the native MT4 indicator functions on that symbol and your chosen timeframe: iATR for volatility, plus iRSI, iStochastic, iADX and iMA for momentum, trend strength and moving-average conditions, along with classic pivot levels. The results are rendered as OBJ_LABEL text objects laid out in columns, wrapping to a new column once a column reaches ColumnHeight symbols.
Everything it shows is a read of current data. It does not predict where price will go, it does not place orders, and the readings update only as fast as the timer interval, so a value you see can be up to that many seconds old.
Which Forex Scanner Dashboard inputs matter most?
The inputs fall into two groups: which symbols to scan and how the table looks, then per-column toggles for each data point. The most useful ones to start with are below; the exact names and defaults match the indicator's input list.
| Input | Default | What it controls |
|---|---|---|
| ShowSymbols | MarketWatch | Source of the symbol list. MarketWatch scans every symbol open in your Market Watch; Custom uses the list you type in CustomSymbols. |
| CustomSymbols | (empty) | Slash-separated symbols to scan when ShowSymbols is set to Custom, for example EURUSD/GBPUSD/USDJPY. Ignored in MarketWatch mode. |
| TimerInterval | 60 | How often the table refreshes, in seconds. Lower values update faster but recalculate every symbol more often, which costs more CPU. |
| ColumnHeight | 50 | Maximum symbols per column before the table wraps into a new column. Lower it if a long watchlist runs off the bottom of the chart. |
| ShowPrice | true | Show the current price column for each symbol. |
| ShowSpread | true | Show the live spread per symbol, useful for spotting wide or unusual spreads before entering. |
| ShowSwap | true | Show the swap (rollover) values, helpful for carry and overnight-hold decisions. |
| ShowATR | true | Show Average True Range as a volatility read for each symbol. |
| AtrTimeframe | PERIOD_H1 | Timeframe the ATR column is calculated on, independent of the chart you dropped the panel on. |
| AtrPeriod | 20 | Lookback length for the ATR calculation. |
How do you add Forex Scanner Dashboard to MetaTrader 4?
- Unzip the download and locate the indicator file from the zip (the .mq4).
- In MetaTrader 4, click File then Open Data Folder.
- Open the MQL4 folder, then the Indicators folder.
- Copy the .mq4 file from the zip into MQL4/Indicators.
- Back in MT4, right-click Indicators in the Navigator panel and choose Refresh (or restart MT4).
- Drag the Forex Scanner Dashboard from Navigator onto any open chart and confirm settings in the dialog.
- Make sure the symbols you want to scan are added to Market Watch, or switch ShowSymbols to Custom and list them.
Where does Forex Scanner Dashboard help, and where does it fall short?
What Forex Scanner Dashboard does well, and where it falls short, with nothing hidden.
- Scans your entire watchlist from a single chart, so you stop flipping between pairs to check conditions.
- Bundles many standard reads (price, spread, swap, ATR, RSI, Stochastic, ADX, pivots, moving averages) into one table.
- Per-column toggles let you strip the panel down to only the data you actually use.
- Each column can run on its own timeframe, independent of the chart it sits on.
- Free and MIT-licensed, so you can use, study and modify the source without restriction.
- It is a screening dashboard, not a signal tool. It reads current conditions and never tells you to buy, sell or where price is headed.
- Readings refresh only every TimerInterval seconds, so values can be slightly stale and a very low interval on a long watchlist adds CPU load.
- A large Market Watch produces a dense table that can crowd the chart; you may need to tune ColumnHeight and font size to keep it readable.
- Each symbol must be present in Market Watch and have history loaded, or its row will be blank or missing.
- It shows raw indicator values, not interpretation, so you still need to know what an RSI, ADX or pivot reading means.
Download Forex Scanner Dashboard free
Enter your email and we will send you Forex Scanner Dashboard for MetaTrader 4, packaged with its original MIT licence and a credit to Carlos Oliveira. Come back for any of the other free tools whenever you want one.
We never share or sell your email. One-click unsubscribe in every message.
Forex Scanner Dashboard: questions traders ask
Does the Forex Scanner Dashboard place trades or give buy/sell signals?
No. It is a read-only screening panel. It displays current price and indicator values for each symbol and never opens, closes or recommends trades.
Does it repaint?
The panel is not a plotted line or arrow, so repainting in the usual sense does not apply. It shows current values that refresh on the timer; a value can simply update on the next refresh as fresh data arrives.
Will it work on MT5?
No. This is an MT4 indicator built against the MT4 API. It will not compile or run in MetaTrader 5 without a port.
Is it really free?
Yes. It is released under the MIT license (Copyright 2016, Carlos Oliveira), so you can use, modify and redistribute it freely.
Why is a symbol's row blank or missing?
The scanner only reads symbols that are in your Market Watch (or in your CustomSymbols list) and that have price history available. Add the symbol to Market Watch and let its history load, then wait for the next refresh.
Can I scan instruments other than forex pairs?
Yes. It reads whatever symbols are in your Market Watch, so indices, metals and commodities your broker offers can be scanned alongside currency pairs.