Equity Line Indicator for MT4
- Category
- Account & Trade Tools
- Platform
- MetaTrader 4, MetaTrader 5
- Repaints?
- No, updates on closed bars
- Licence
- Apache-2.0
- Inputs
- 2
- Price
- Free
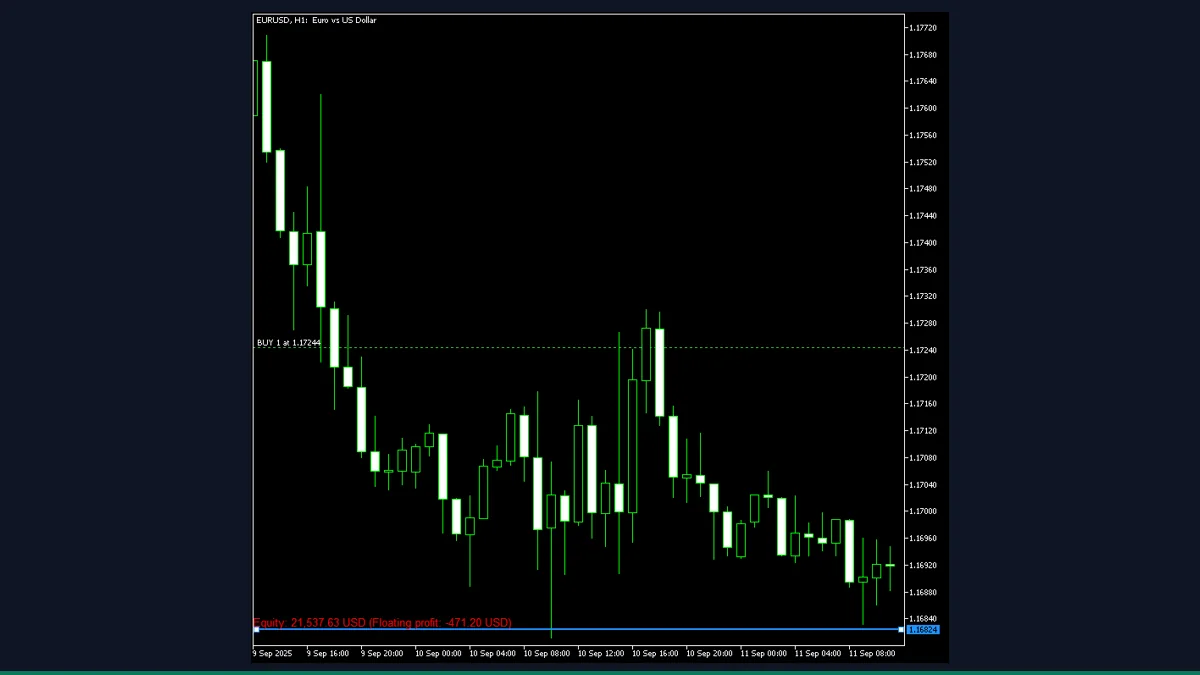
Equity Line is a free MT4 and MT5 tool from EarnForex that drops a draggable horizontal line on your chart and shows what your account equity would become if price reaches that level, based on your open trades in the current symbol. It is for traders who want a quick visual what-if on their floating P&L.
If you have ever wanted to know "where does my equity sit if EUR/USD hits this price?" without doing the math in your head, that is exactly what Equity Line answers. It is a small, honest utility from EarnForex that draws one draggable line and updates a live equity figure as you slide it up and down your chart.
What is Equity Line, and what does it do in MT4?
Equity Line is an account utility for MetaTrader 4 (a MetaTrader 5 build ships in the same package). It places a single horizontal line on the chart that you drag with your mouse. Wherever you put it, the indicator reads your open positions on the current symbol, works out the floating profit or loss they would show if price reached that line, and prints your projected account equity in a label next to it.
It is a planning and what-if tool, not a signal generator and not a market predictor. It does not tell you where price is going or when to enter. It simply takes the price level you choose and tells you the equity consequence of your existing trades arriving there.
On load, the indicator draws a horizontal line a set number of points away from the current Bid (the InitialPriceOffset input). You then drag that line to any price you want to test. On every drag, on a timer, and on each new tick, it recalculates.
The calculation reads your live account equity with AccountEquity(), then loops through every open order. It only counts market orders (buy and sell) that belong to the chart's current symbol; pending orders and trades on other pairs are ignored. For each qualifying position it computes the profit or loss at your chosen line price using the symbol's point value, then adds that change to your current equity. The result is shown as "Equity:" plus a "Floating profit" figure, formatted in your account currency with thousands separators.
The label turns green when the projected equity is above current equity and red when it is below (colors are configurable). Press Shift+E at any time to hide or show the line and label without removing the indicator. The point-value math includes currency conversion when the symbol's profit currency differs from your account currency, so the figure stays correct on cross pairs and CFDs.
Which Equity Line inputs matter most?
The inputs are all cosmetic or behavioral. None of them change the math itself, so you can leave the defaults and still get an accurate projection. These are the ones worth knowing.
| Input | Default | What it controls |
|---|---|---|
| UpdateFrequency | 1 | How often, in seconds, the projection recalculates on its timer. Lower is more responsive but does slightly more work per second. |
| InitialPriceOffset | 50 | How far above the current price, in points, the line first appears when you attach the indicator. Just a starting position; you drag it from there. |
| LineColor | clrDodgerBlue | Color of the draggable projection line. |
| LineWidth | 2 | Thickness of the projection line in pixels. Bump it up if you keep losing the line against busy candles. |
| LineStyle | STYLE_SOLID | Line style (solid, dashed, dotted). Cosmetic only. |
| ShowLabel | true | Turns the equity and floating-profit text label on or off. With it off you keep the line but lose the readout. |
| LabelPositiveChangeColor | clrGreen | Label color when projected equity is higher than your current equity. |
| LabelNegativeChangeColor | clrRed | Label color when projected equity is lower than your current equity. |
How do you add Equity Line to MetaTrader 4?
- Download and unzip the Equity Line package; it contains the indicator file for MT4 (.mq4) and an MT5 version (.mq5).
- In MetaTrader 4, open File then Open Data Folder.
- Navigate into the MQL4 folder, then the Indicators subfolder.
- Copy the MT4 indicator file from the zip into that Indicators folder.
- Back in MT4, right-click Indicators in the Navigator panel and choose Refresh (or restart the terminal).
- Drag the Equity Line indicator from the Navigator onto the chart of the symbol you want to project.
- Click OK on the inputs dialog, then drag the blue line to any price level to read your projected equity.
Where does Equity Line help, and where does it fall short?
What Equity Line does well, and where it falls short, with nothing hidden.
- Free and open-source under Apache-2.0, with the full .mq4 source in the package so you can read or modify it.
- Instant, visual what-if: drag one line and read your projected equity in your account currency, no manual math.
- Handles currency conversion correctly, so the equity figure stays right on cross pairs and CFDs whose profit currency differs from your account.
- Color-coded label (green above, red below current equity) makes the up or down outcome obvious at a glance.
- Shift+E toggle hides the line without detaching the indicator, so it stays out of the way until you need it.
- Ships for both MetaTrader 4 and MetaTrader 5 in the same download.
- Only counts open trades on the chart's current symbol. If you hold positions across several pairs, no single chart shows your whole-account equity at that move.
- It does not predict price. It only tells you the equity result of a level you pick yourself, so it is a calculator, not a forecast.
- Ignores pending orders entirely, so it will not show equity if a pending entry fills first.
- Assumes only the current symbol moves to the line; correlated moves on your other open pairs are not reflected.
- One line at a time means you cannot compare two target levels side by side on the same chart.
- The figure is a projection on present positions; it does not account for trades you might open or close before price gets there.
Download Equity Line free
Enter your email and we will send you Equity Line for MetaTrader 4, packaged with its original Apache-2.0 licence and a credit to EarnForex.com. Come back for any of the other free tools whenever you want one.
We never share or sell your email. One-click unsubscribe in every message.
Equity Line: questions traders ask
Does the Equity Line indicator place or close trades?
No. It is a read-only display utility. It reads your open positions and your account equity and shows a projection; it never sends an order or touches your trades.
Does it repaint?
There is nothing to repaint in the usual sense. It does not draw historical signals on past bars. It shows a live projection for a line you position, and that number updates as price and your positions change, which is expected behavior, not repainting.
Does it show my whole account equity?
No. It only accounts for open trades on the current chart's symbol. Positions on other pairs are not included, so for a multi-pair account no single chart reflects your full equity at that move.
Is it free, and can I edit it?
Yes. It is released under the Apache-2.0 license by www.EarnForex.com, 2025, and the .mq4 source is included, so you are free to use and modify it.
Does it work on MetaTrader 5?
Yes. The download includes a separate MT5 (.mq5) build alongside the MT4 version. Install the .mq5 into the MQL5/Indicators folder on MT5.
How do I hide the line without removing the indicator?
Press Shift+E on the chart to toggle the line and label off, and Shift+E again to bring them back.