Draw Grid: MT4 Price Grid Indicator
- Category
- Chart & Terminal Tools
- Platform
- MetaTrader 4, MetaTrader 5
- Repaints?
- No, updates on closed bars
- Licence
- Apache-2.0
- Inputs
- 10
- Price
- Free
Draw Grid is a free MT4 and MT5 utility from EarnForex that plots evenly spaced horizontal price lines at a point step you set, plus an optional finer sub-grid. It draws levels, it does not signal trades. Best for scalpers and range traders who want clean, repeatable reference lines.
If you mark out fixed price levels by hand every session, Draw Grid does that job for you. It is a free, open-source MT4 and MT5 indicator that drops a set of evenly spaced horizontal lines onto your chart at a step you choose, with a small on-chart panel to draw, delete, and re-tune the grid on the fly.
What is Draw Grid, and what does it do in MT4?
Draw Grid is a charting utility, not a trading signal. It builds a ladder of horizontal price lines (MT4 OBJ_HLINE objects) spaced a fixed number of points apart, anchored to a start price you pick or to the current price. You decide the gap, the colors, the line styles, and the price range the grid covers.
It is published by EarnForex.com under the Apache-2.0 license and runs on both MetaTrader 4 and MetaTrader 5. The same code also draws an optional second, finer grid inside the main one, so you can see major levels and minor sub-levels at a glance.
On load, the indicator reads your symbol's point size and your chosen start price (the current close if you leave StartPrice at 0). When you press the pencil button on its panel, it steps upward and downward from that start price in increments of MainGap points, creating one horizontal line at each level until it reaches the high and low bounds. If ShowSubGrid is on, it repeats the same process using the smaller SubGap step to lay a secondary grid over the same range.
The high and low bounds default to the visible chart high and low (extended by one main gap) when you leave HighRange and LowRange at 0, so the grid fills the screen. A small draggable mini-panel sits in the corner with three buttons: a pencil to draw the grid, a hand to clear it, and a PC icon that opens a settings box where you can edit start price, range, gaps, and toggle the sub-grid without reloading the indicator. With UpdateStartPrice enabled, the start price tracks the live Bid.
It is important to be clear: Draw Grid only reads price and draws lines. It performs no analysis, gives no buy or sell direction, and places no orders. The levels are purely geometric reference points spaced at your chosen interval.
Which Draw Grid inputs matter most?
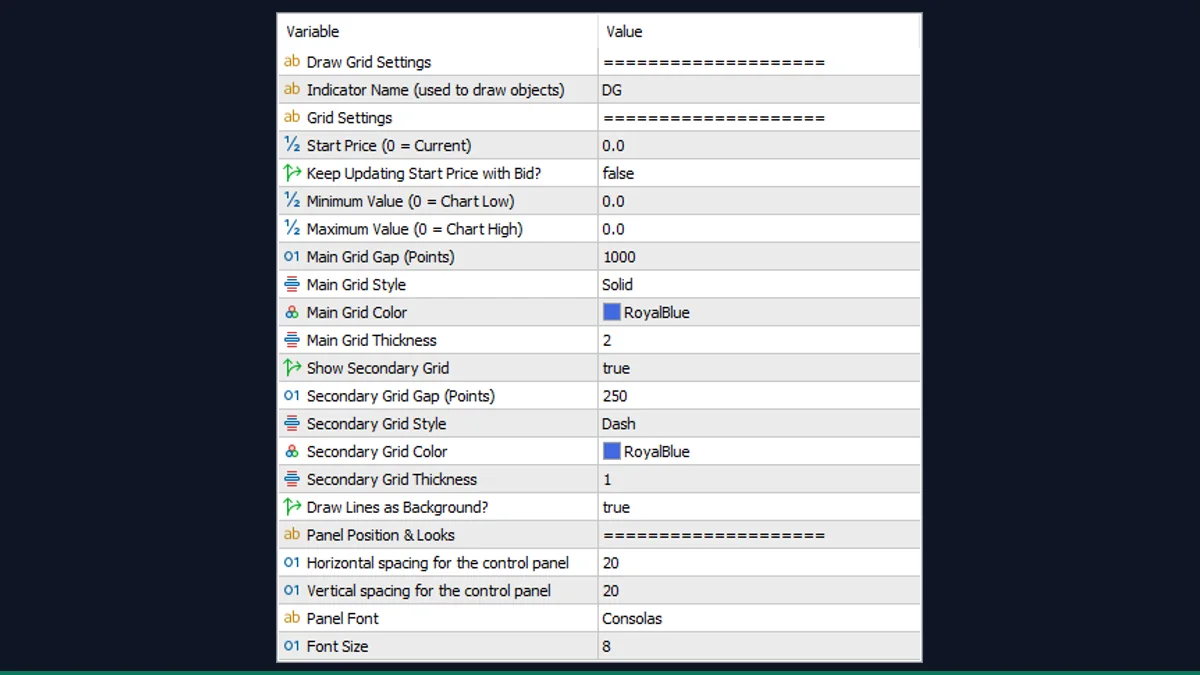
The full input list is long, but most traders only touch a handful. These are the settings that actually change how the grid looks and where it sits.
| Input | Default | What it controls |
|---|---|---|
| MainGap | 1000 | Spacing of the main grid lines in points. 1000 points is 100 pips on a 5-digit FX pair. Set this to your level interval. |
| StartPrice | 0 | The price the grid is anchored to. 0 uses the current price; enter a value to pin the grid to a fixed level. |
| UpdateStartPrice | false | When true, the start price keeps following the live Bid, so the grid re-centers on price. Leave false to keep it fixed. |
| LowRange | 0 | Lowest price the grid reaches. 0 uses the chart low (extended by one main gap). |
| HighRange | 0 | Highest price the grid reaches. 0 uses the chart high (extended by one main gap). |
| ShowSubGrid | true | Turns the secondary finer grid on or off. Useful for seeing minor levels between the main lines. |
| SubGap | 250 | Spacing of the secondary grid lines in points. Should be smaller than MainGap to sit inside it. |
| MainColor | clrRoyalBlue | Color of the main grid lines. SubColor sets the secondary grid separately. |
| MainThick | Two | Line thickness of the main grid (1 to 5). MainStyle sets solid, dash, or dotted. |
| LinesBackground | true | Draws the lines behind the candles so they do not cover price action. |
How do you add Draw Grid to MetaTrader 4?
- Unzip the download. It contains the indicator file plus an Include (.mqh) file and an icon in their folders.
- In MetaTrader, click File then Open Data Folder.
- Open MQL4, then Indicators, and copy the indicator file from the zip into that folder.
- Open MQL4, then Include, and copy the .mqh file from the zip into that folder so the indicator can compile.
- Back in MetaTrader, right-click Indicators in the Navigator panel and choose Refresh.
- Drag Draw Grid from the Navigator onto a chart, set MainGap and colors, and click OK.
- Press the pencil button on the on-chart panel to draw the grid.
Where does Draw Grid help, and where does it fall short?
What Draw Grid does well, and where it falls short, with nothing hidden.
- Free and open-source under Apache-2.0, with the full MQL4 source available so you can read or modify it.
- Runs on both MetaTrader 4 and MetaTrader 5 from the same download.
- Fast on-chart panel lets you draw, delete, and re-tune the grid without reopening the inputs window.
- Does not repaint and uses no indicator buffers; lines stay exactly where they were placed.
- Separate main and secondary grids with independent color, style, and thickness give a clean, readable layout.
- It is a drawing utility only. It gives no signals, no direction, and places no trades; all interpretation is on you.
- Gaps are set in points, not pips, so 100 pips means 1000 on a 5-digit pair. New users often mis-set the step the first time.
- Lines are horizontal price levels only. There is no diagonal, trendline, or time-based grid option.
- The grid does not auto-redraw as price moves out of range unless you enable UpdateStartPrice and click draw again.
- On very wide ranges with a small gap it can create a large number of line objects, which clutters the chart and can slow a weak machine.
Download Draw Grid free
Enter your email and we will send you Draw Grid for MetaTrader 4, packaged with its original Apache-2.0 licence and a credit to EarnForex.com. Come back for any of the other free tools whenever you want one.
We never share or sell your email. One-click unsubscribe in every message.
Draw Grid: questions traders ask
Does Draw Grid repaint?
No. It draws fixed horizontal line objects at the levels you set and does not move or recalculate them. The lines stay put until you delete them or click draw again with new settings.
Does it place trades or give buy and sell signals?
No. Draw Grid is purely a charting tool. It draws price levels and nothing else; there are no entries, exits, alerts, or direction calls. You make all trading decisions yourself.
Is it really free?
Yes. It is released by EarnForex.com under the Apache-2.0 open-source license, so you can use, study, and modify it at no cost.
Why is my grid spacing wrong?
The gap is in points, not pips. On a 5-digit forex pair 10 points equals 1 pip, so for a 100-pip step set MainGap to 1000. Adjust the value to match your broker's digits.
Does it work on MetaTrader 5?
Yes. The download includes both an MT4 (.mq4) and an MT5 (.mq5) version, so it runs on either platform.
Can the grid follow price as the market moves?
Yes, partly. Set UpdateStartPrice to true and the anchor tracks the live Bid, but you still press the pencil button to redraw the grid at the new center.