Coppock Curve Indicator for MT4
- Category
- Trend & Momentum
- Platform
- MetaTrader 4, MetaTrader 5
- Repaints?
- See the honest review below
- Licence
- Apache-2.0
- Inputs
- 8
- Price
- Free
The Coppock Curve is a free long-term momentum oscillator for MT4 and MT5. It sums two rate-of-change readings, smooths them with a weighted moving average, and plots a histogram in a separate window with optional turn-based arrows and alerts. It suits position traders watching monthly or higher-timeframe momentum, not scalpers.
The Coppock Curve is a momentum oscillator originally built by E.S.C. Coppock in 1962 to time long-term entries on stock indices. This MT4 build by EarnForex is an Apache-2.0 re-implementation that plots the curve as a histogram in a separate window, adds multi-timeframe support, and can mark momentum turns with arrows and alerts.
What is Coppock Curve, and what does it do in MT4?
The Coppock Curve is a single-line momentum oscillator. It was designed by economist E.S.C. Coppock for long-horizon timing on broad stock indices, and the classic recipe is meant to be read on the monthly chart. This version is EarnForex's own open-source re-implementation, with credit retained to Robert Hill, whose earlier MT4 code it is based on.
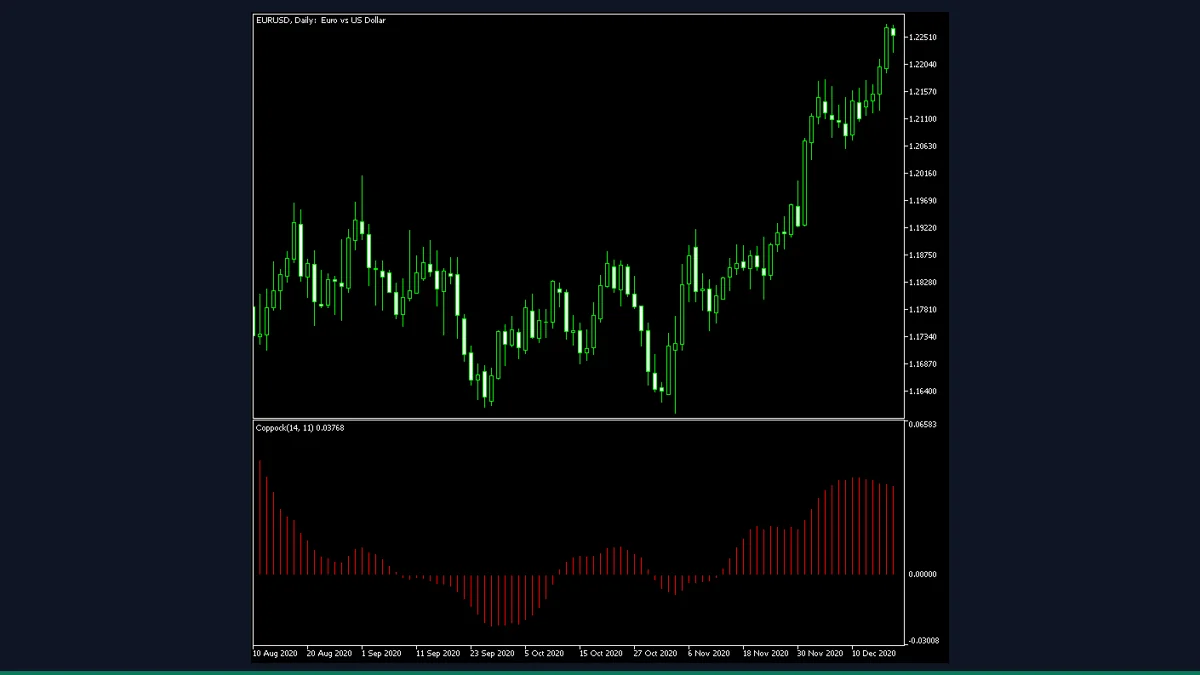
On the chart it appears as a red histogram in a separate window below price. The histogram rises and falls with momentum, crosses a zero line, and the indicator can place a BUY or SELL arrow on the price chart when the curve changes direction. It is an analytical study, not an expert advisor, so it reads price and draws on the chart but never sends orders.
The calculation starts with two rate-of-change values measured over different lookbacks, by default ROC1Period of 14 and ROC2Period of 11. Each ROC compares the current close to the close that many bars ago and expresses the difference as a percentage. The indicator adds the two ROC readings together into a single momentum sum.
That summed value is then smoothed with a moving average, by default a 10-period linear weighted moving average (MAType set to MODE_LWMA, MAPeriod 10). The result is the Coppock value plotted as the histogram. You can switch the smoothing to SMA, EMA, or SMMA if you want to experiment, though the weighted average is the traditional choice.
For signals, the indicator looks for a turn in the curve. When the Coppock value stops falling and turns up it can mark a BUY, and when it stops rising and turns down it can mark a SELL. With StrictSignals enabled (the default), a BUY arrow only prints while the curve is below zero and a SELL arrow only prints while it is above zero, which mirrors the classic emphasis on momentum recovering from depressed levels. The optional TimeFrame input lets the curve be computed on a higher timeframe than the chart you are viewing.
Which Coppock Curve inputs matter most?
Defaults match the classic Coppock recipe, so most traders only touch the timeframe and the alert toggles. The inputs below are the ones worth knowing.
| Input | Default | What it controls |
|---|---|---|
| TimeFrame | PERIOD_CURRENT | Timeframe used to compute the curve. Leave it on the chart timeframe, or set a higher one to read, for example, monthly momentum while viewing a weekly chart. |
| ROC1Period | 14 | Lookback for the first rate-of-change. The classic long value; raising it slows the curve, lowering it speeds it up. |
| ROC2Period | 11 | Lookback for the second rate-of-change, summed with the first. Together with ROC1 it sets how much past momentum feeds the curve. |
| MAPeriod | 10 | Length of the moving average that smooths the ROC sum into the final Coppock line. Higher is smoother and slower. |
| MAType | MODE_LWMA | Smoothing method. LWMA is the traditional weighted average; SMA, EMA, and SMMA are available for experimentation. |
| StrictSignals | true | When true, BUY arrows print only below zero and SELL arrows only above zero. Turn off to get a turn-arrow at any level. |
| TriggerCandle | CLOSED_CANDLE | Whether signals and alerts evaluate on the last closed candle (stable) or the current forming candle (earlier but can change). |
| EnableDrawArrows | true | Draws BUY and SELL arrows on the price chart at momentum turns. Set false for a clean histogram-only display. |
| EnableNativeAlerts | false | Pops an in-terminal alert on a new signal. Email, push, and sound alerts have their own separate toggles. |
How do you add Coppock Curve to MetaTrader 4?
- Download and unzip the indicator archive to a folder you can find.
- In MetaTrader 4, click File then Open Data Folder.
- Open the MQL4 folder, then the Indicators folder inside it.
- Copy the indicator file from the zip into that Indicators folder.
- Back in MT4, right-click Navigator and choose Refresh so the indicator appears.
- Drag the Coppock Curve from Navigator onto a chart, ideally a monthly or weekly one.
- In the inputs tab, adjust the timeframe, smoothing, or alerts if you want, then click OK.
Where does Coppock Curve help, and where does it fall short?
What Coppock Curve does well, and where it falls short, with nothing hidden.
- Free and open source under the Apache-2.0 licence, with the original source available so you can read or modify it.
- Faithful to the classic Coppock recipe out of the box, with the traditional 14/11 ROC and 10-period weighted average as defaults.
- Multi-timeframe input lets you read higher-timeframe momentum without leaving your current chart.
- Optional turn arrows plus four alert channels (terminal, email, push, sound) so you do not have to watch the window constantly.
- Works on MT4 and MT5, and the smoothing type is switchable if you want to experiment beyond the classic settings.
- It is a momentum study, not a trading system. It draws and alerts but never places orders or manages risk, and it makes no promise about what price does next.
- Built for long horizons. On the monthly or weekly chart it gives very few signals, and forcing it onto fast intraday charts produces noisy, less meaningful turns.
- Like all moving-average-based momentum, it lags. The arrow confirms a turn that has already begun rather than calling the exact bottom or top.
- The strict below-zero / above-zero rule can keep arrows off the chart during strong trends, so it can miss continuation moves that never dip back across zero.
- Designed and historically tested on stock indices. On forex pairs or ranging markets the turns are far less reliable than the original index use case.
- Signals on the current candle can repaint until that candle closes; only closed-candle signals are stable.
Download Coppock Curve free
Enter your email and we will send you Coppock Curve for MetaTrader 4, packaged with its original Apache-2.0 licence and a credit to EarnForex.com. Come back for any of the other free tools whenever you want one.
We never share or sell your email. One-click unsubscribe in every message.
Coppock Curve: questions traders ask
Does the Coppock Curve repaint?
The histogram itself is calculated on closed price data and is stable. Signal arrows and alerts repaint only if you set TriggerCandle to the current candle, because the forming bar can still change. Leave TriggerCandle on CLOSED_CANDLE for non-repainting signals on the last closed bar.
Does it place trades for me?
No. It is an analytical indicator, not an expert advisor. It plots the curve, draws arrows, and can alert you, but it never opens, closes, or manages any positions. Any trading decision and risk control is yours.
Is it really free?
Yes. It is released under the Apache-2.0 licence by EarnForex, so you can download, use, and modify it at no cost. Credit belongs to Copyright © 2010-2025, EarnForex.com, and to the original Coppock idea.
Does it work on MT5?
Yes. The download includes both an MT4 and an MT5 version, so you can run it on either platform with the same inputs.
What timeframe should I use?
The classic Coppock recipe is meant for the monthly chart on stock indices. Weekly and daily are reasonable for shorter horizons. It is not designed for fast intraday charts, where the long lookbacks produce noisy turns.
Why are no arrows showing in a strong trend?
With StrictSignals on, BUY arrows only print below zero and SELL arrows only above zero. During a sustained trend the curve may never cross back, so it stays quiet. Turn StrictSignals off to get turn arrows at any level.
Idea credited to E.S.C. Coppock (1962); EarnForex's own Apache-2.0 re-implementation, Robert Hill credit retained.